Statistics and Probability
There are tools in GeoGebra that lets you examine statistical data and probability distribution functions in a very easy way.
Explanations about regression and how to handle frequency tables and bar charts, can be found under the section Statistics.
Statistical analysis
If you have grouped data (as in columns A-E) or one single list of data (as in column G), you can use GeoGebra's tools for analysing statistics.
In order to use the tool ![]() One Variable Analysis, you first select one or several columns in the
spreadsheet.
One Variable Analysis, you first select one or several columns in the
spreadsheet.
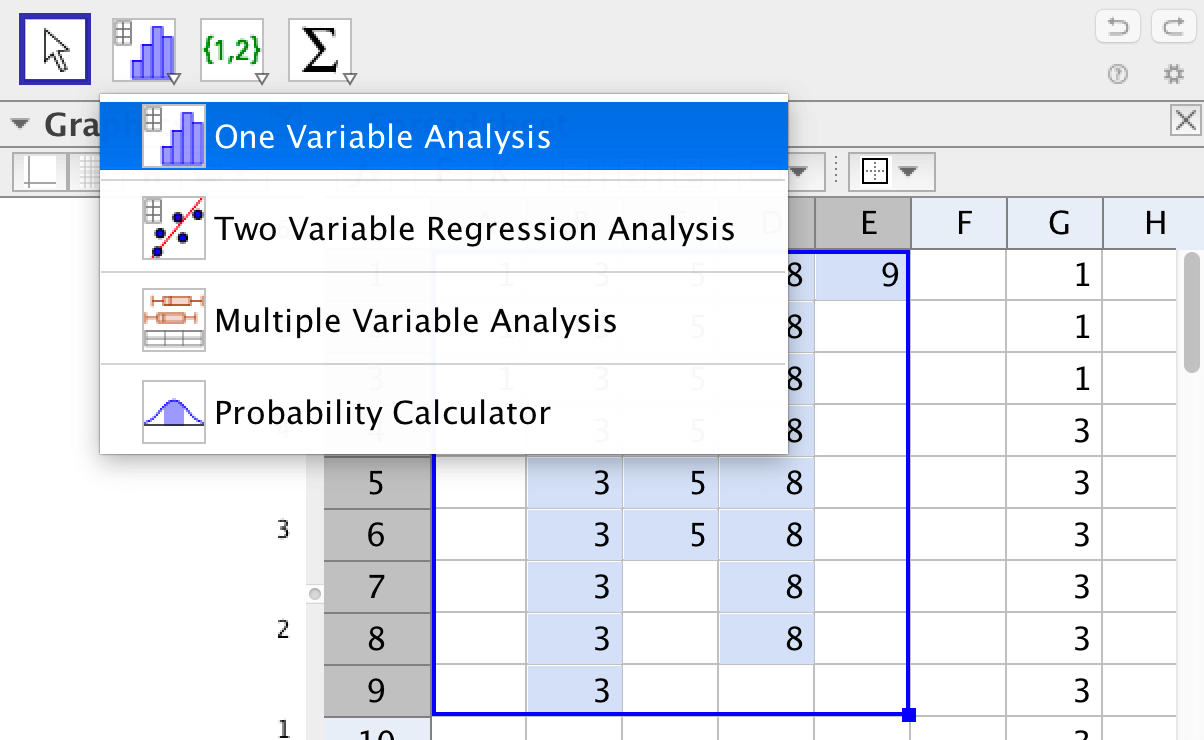
Then you click on Analyze.
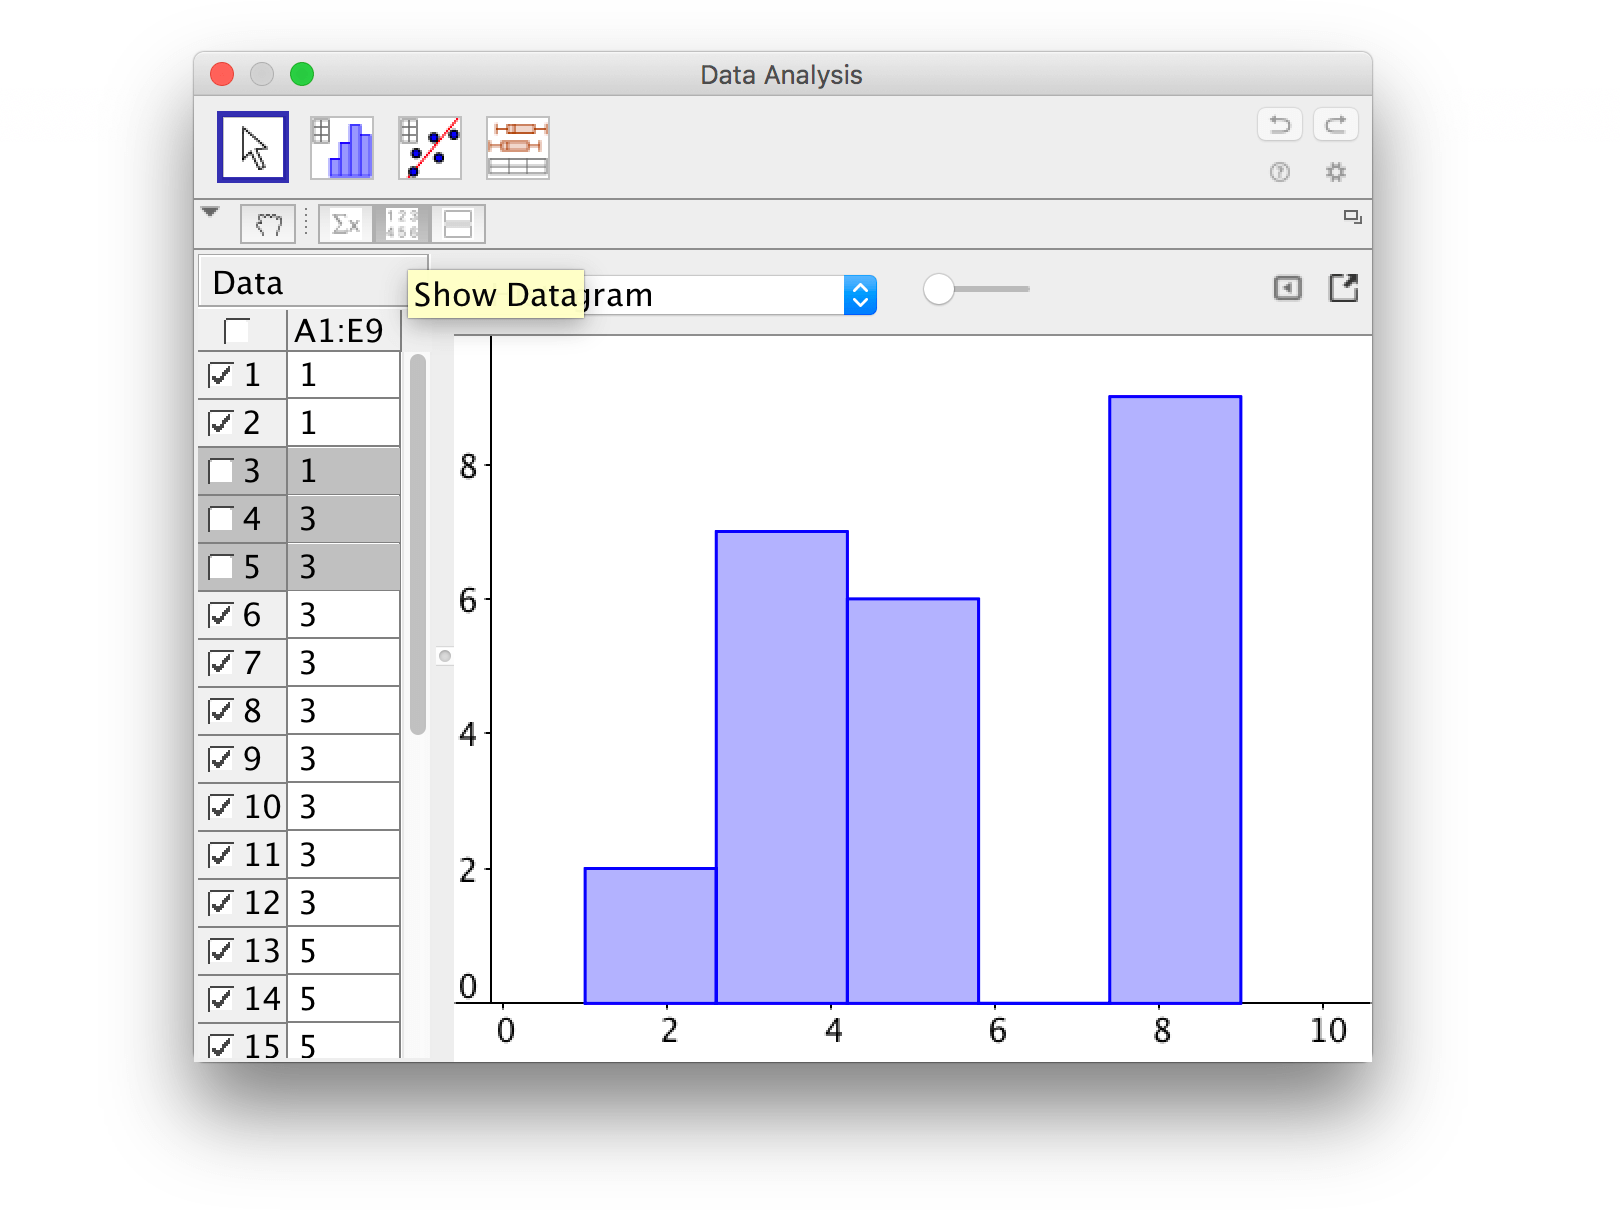
If you click on "Show Data", you can uncheck some values to examine how all statistic changes.
Generate random data
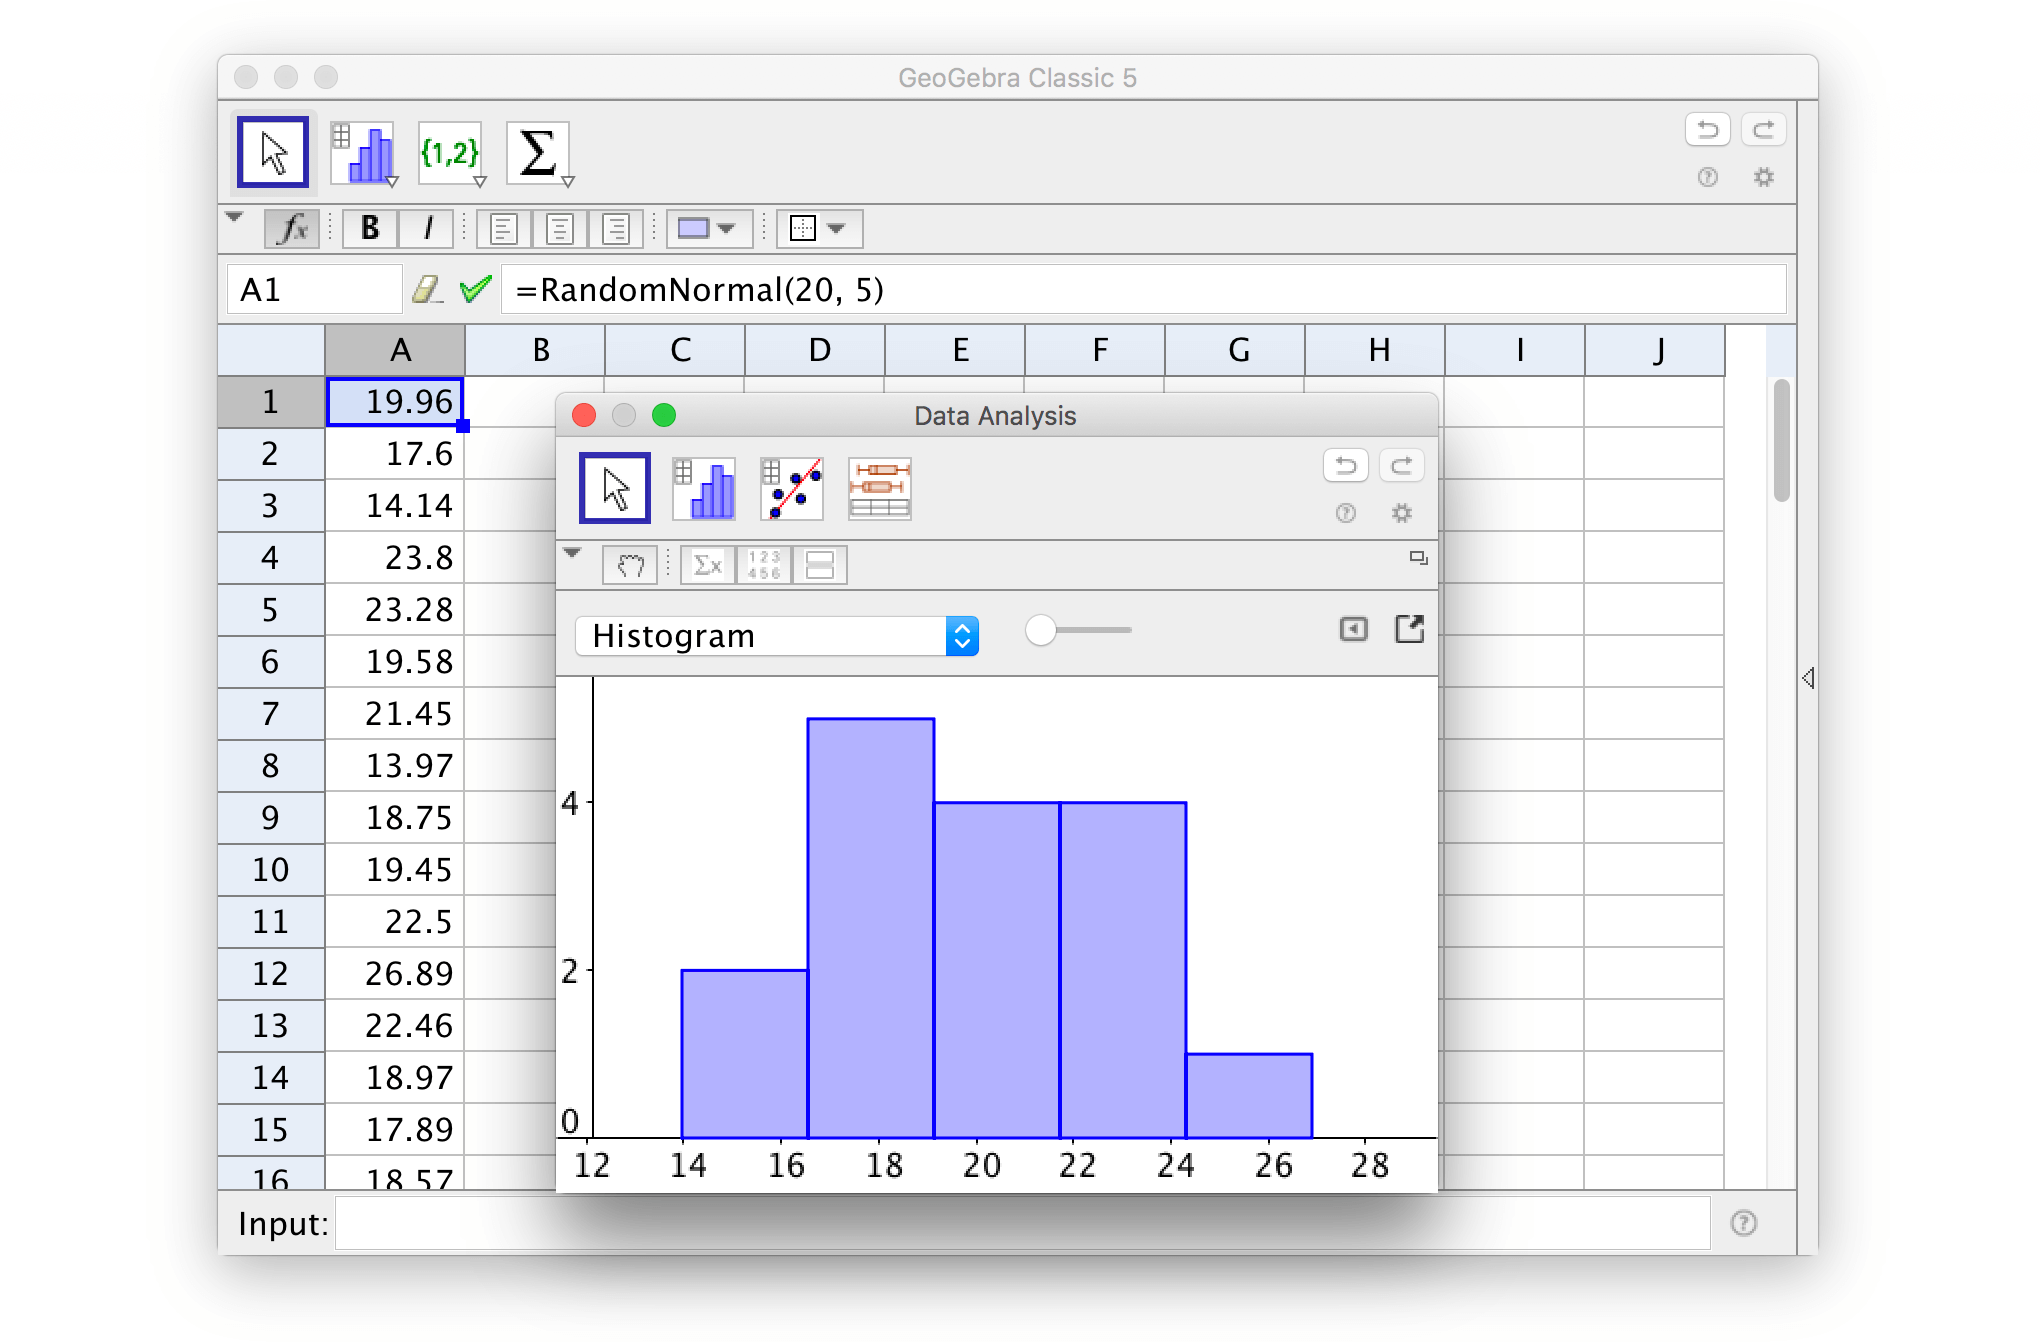
There are a number of commands for generating random numbers.
If you for instance write the code RandomNormal(20,5) in cell A1, you can make as many
relative copies as you need. They will all be randomly generated and normally distributed with a mean of 20 and standard deviation 5.
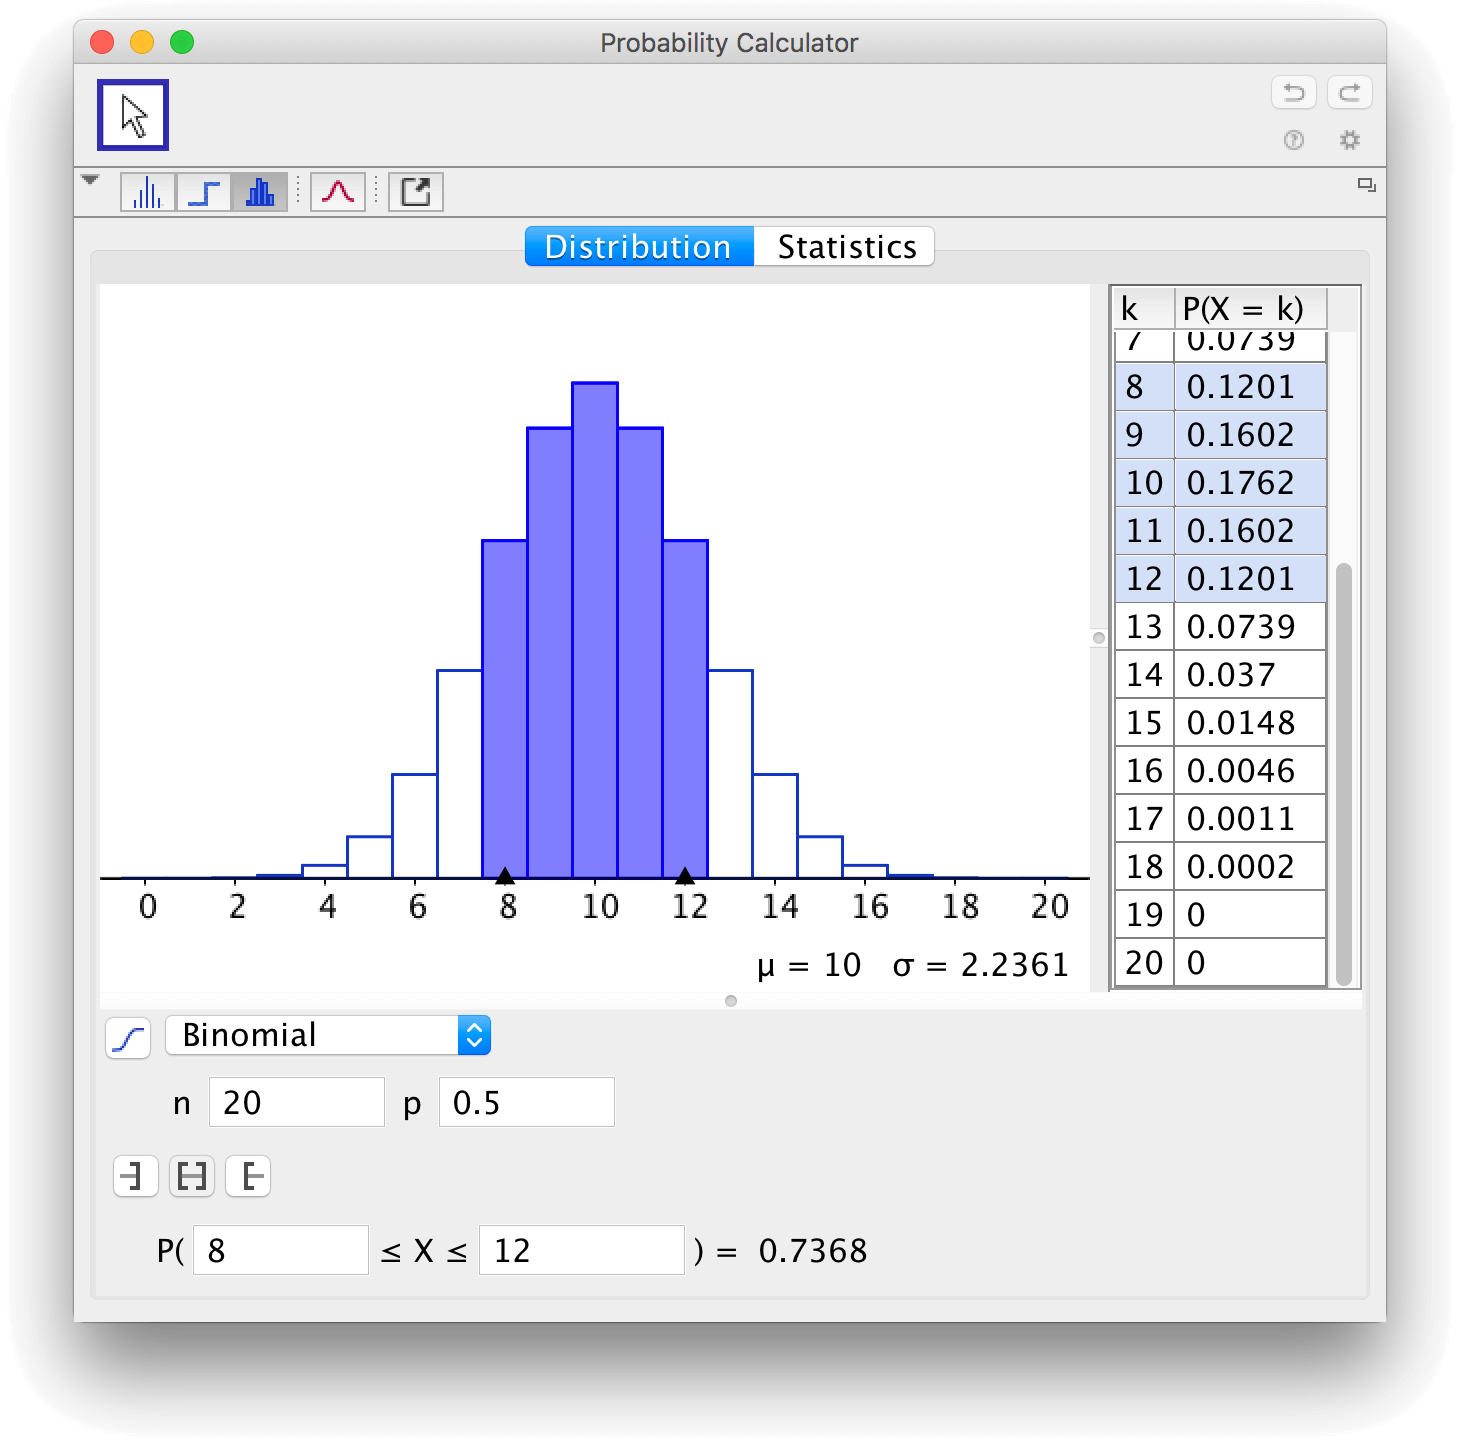
Examine probability distribution functions
By using the tool ![]() Probability calculator, you will
get all possible data regarding probability distribution functions. The tool can be found in the menu belonging to the spreadsheet.
Probability calculator, you will
get all possible data regarding probability distribution functions. The tool can be found in the menu belonging to the spreadsheet.
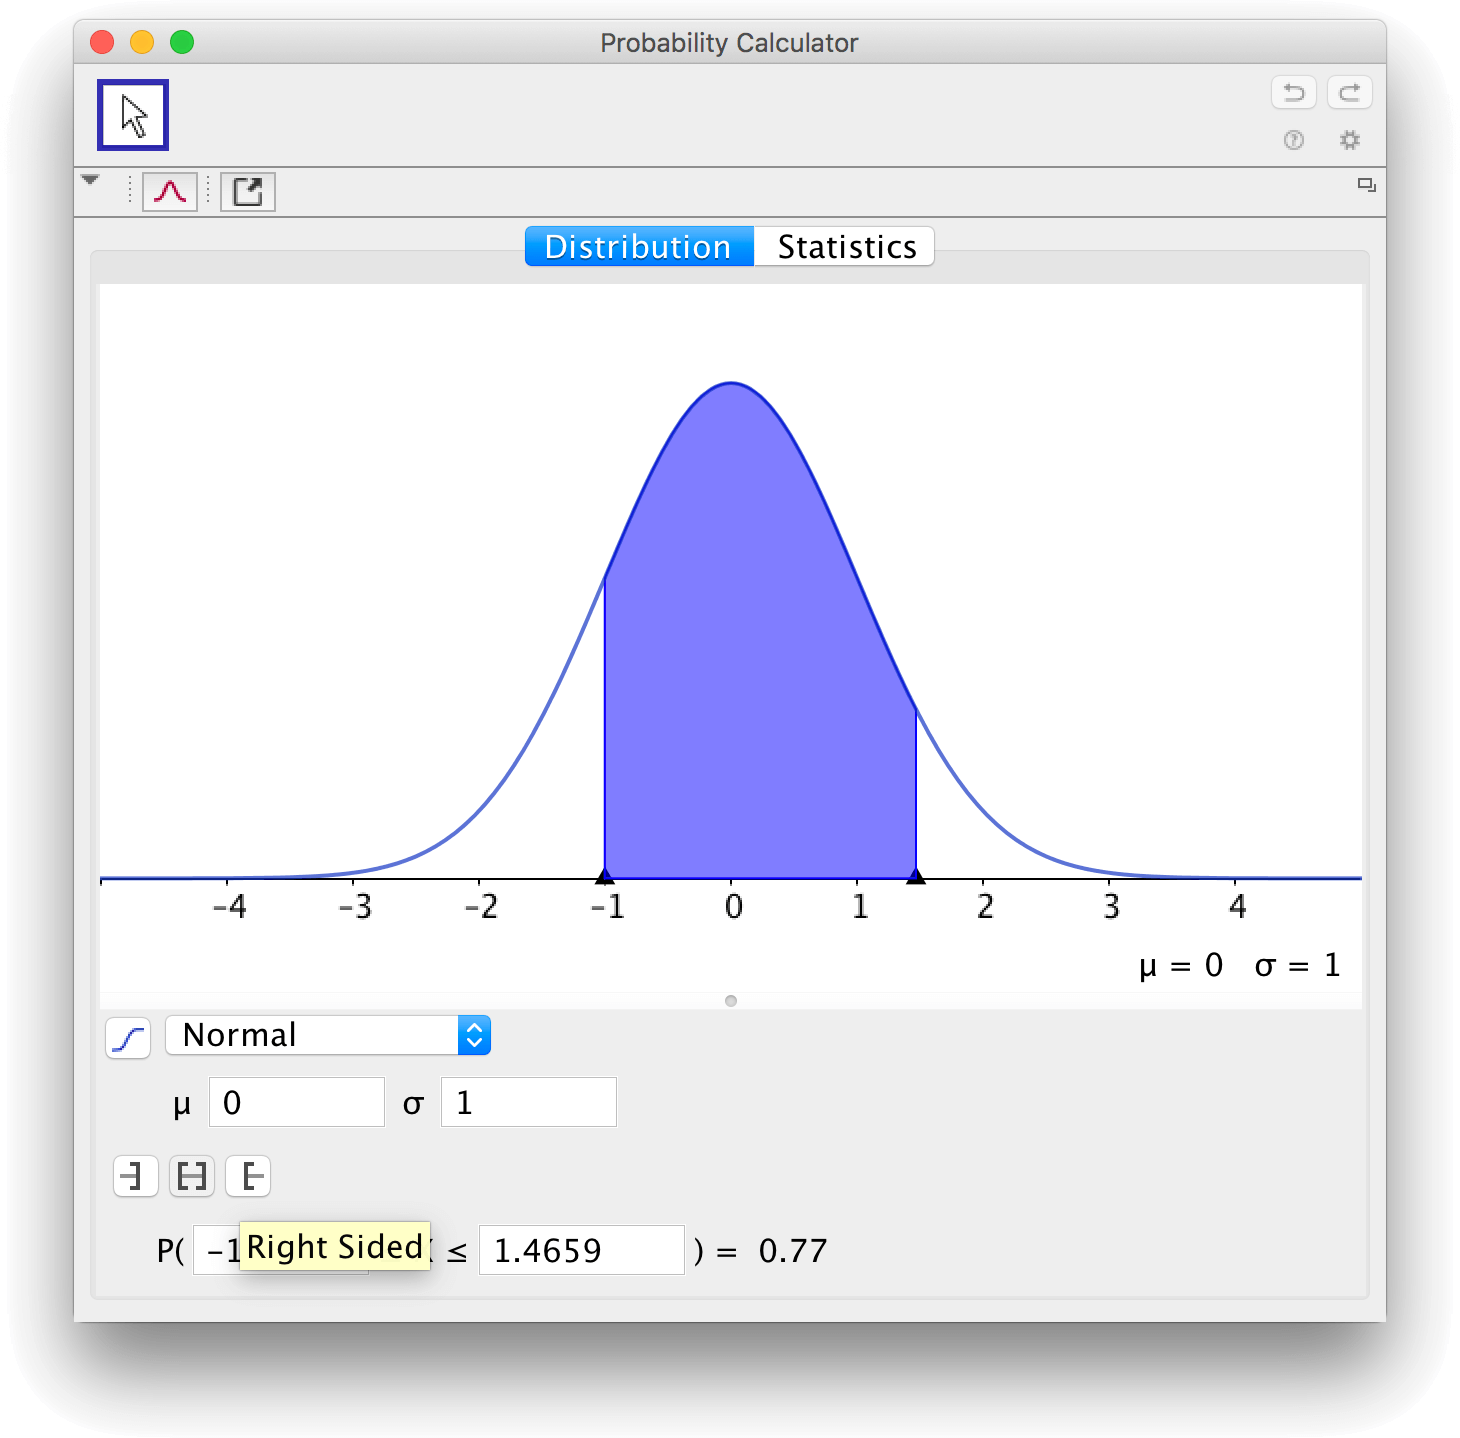
You can change the boundaries by dragging the arrows and you can enter numbers in any box. All values change dynamically.
by Malin Christersson under a Creative Commons Attribution-Noncommercial-Share Alike 2.5 Sweden License