Points and Vectors
In GeoGebra you can create an object either by using a tool in the tool bar or by writing in the input bar. Try entering following in the input bar:
B=(3,-2)

MyPoint=(-1,2)

v=(2,2)
GeoGebra uses following naming convention:
If the first letter is capital, a point is created.
If the first letter is lower case, a vector is created.
The value of vectors are shown in matrix form in the algebra view. A vector has a length and a direction but it has no position. Note that you can move a vector in the graphics view without changing its value.
Sometimes you need the \(x\)- or the \(y\)-coordinate of a point. If you have a point called \(A\), you can find the \(x\)-coordinate and the \(y\)-coordinate respectively by writing:
x(A) and y(A)
The same commands are used for vectors.
The coordinates of a point can be used to make new points. As an example, given a point \(A\) you can enter
B=(x(A),y(A)+1)
in the input bar to make a new point \(B\). If you just write
(x(A),y(A)+1)
a point will be created and GeoGebra will name it.
Arithmetic
By multiplying an existing vector by a scalar in the input bar, you create a new vector. You can also create a new vector by adding or subtracting two existing vectors.
If you multiply two existing vectors in the input bar, the scalar product is created and stored in a new variable.
\[ \vec{v}\cdot \vec{u}=\binom{v_1}{v_2}\cdot\binom{u_1}{u_2} =v_1u_1+v_2u_2 \]You can use vector arithmetic on points. The calculations are performed on the corresponding position vectors. If \(A\) and \(B\) are two points, their respective position vector \(\vec{OA}\) and \(\vec{OB}\) are the vectors starting in \(O\) (the origin in this case) and ending at the point in question.
Commands
The commands Point and Vector can be used to create new points/vectors from existing points/vectors.
Given a point \(A\) you can make a vector \(u\) by using the command Point(A). The vector \(u\) will be the position vector of \(A\).
Given points \(A\) and \(B\) you can make the vector from \(A\) to \(B\) by using the command Vector(A, B).
Given a point \(A\) and a vector \(v\), you can make a new point \(C\) by using the command Point(A,v).
Unit vector
Given a vector \(u\) you create the unit vector using the command UnitVector(u).
Polar coordinates
You can specify the position of a point in a Cartesian plane by specifying its distance, R, from the origin, and the angle to the positive x-axis in a counterclockwise direction, the angle α.
If you right-click on a point in the algebra view you can choose to show the polar coordinates instead of the Cartesian coordinates. GeoGebra writes polar coordinates by using a semi-colon instead if a comma.
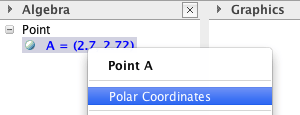
If you want to enter a point using polar coordinates in the input bar, use a semi-colon.
A=(2;30°)
The degree-symbol can be found in the symbol-menu beside the input bar, it can also be written Ctrl+O.
Exercises
Exercise 1
Points and trace
-
Make sure that the axes are shown in the graphics view and make a point \(A\). Write
B = (-x(A), y(A))
in the input bar.
Put a trace on both points (right-click and check Trace On) and drag \(A\). The two points can have different colors. The trace drawn by \(B\) is the reflection in the \(y\)-axis of the trace drawn by \(A\).
You erase a trace by zoomin in or out, or by moving the graphics view.
-
If the point \(C\) is made as
C = (y(A), x(A))
another reflected point of \(A\) is created. Can you describe the reflection without creating \(C\)? Check out if you were correct by creating \(C\) in GeoGebra.
Exercise 2
Relations between coordinates
In the worksheet below five points depend on \(A\).
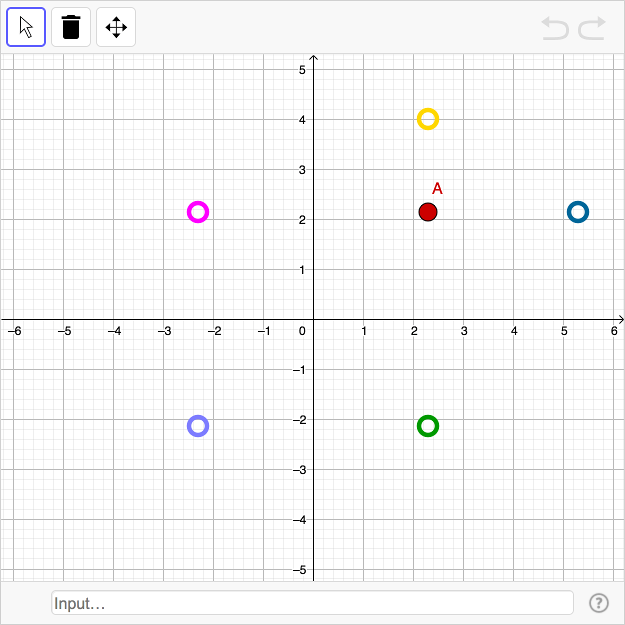
If you write
(x(A)+3, y(A))
in the input bar of the worksheet, a point is created above the blue hollow point (inside the ring).
Drag the point \(A\) and find the relations between coordinates for the other points. Create four new points by writing in the input bar. The new points should appear above the hollow points (inside each ring).
Exercise 3
Make a coordinate exercise
Make an exercise similar to Exercise 2.
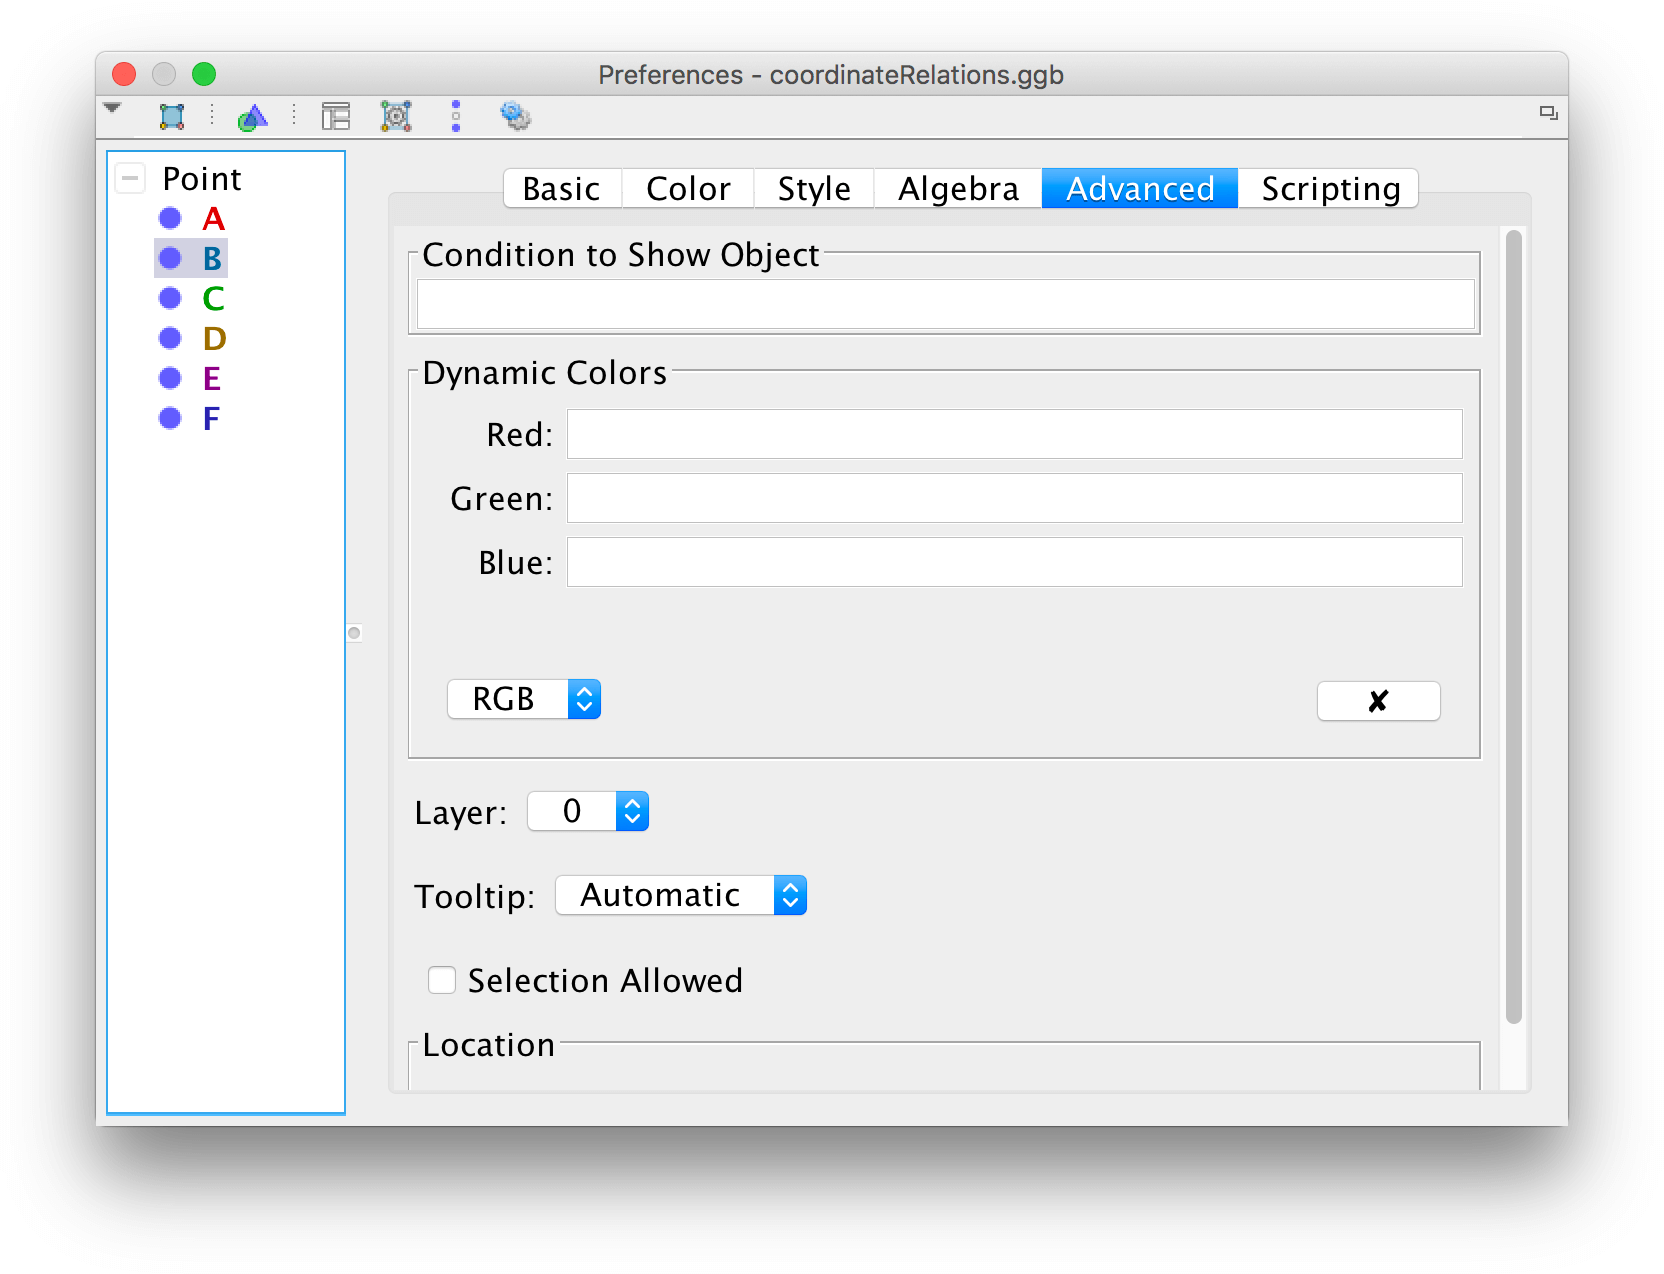
In order for the worksheet to be as user-friendly as possible, you can see to it that the mouse cursor only has a different appearance when hovered above the draggable point. Right-click on a point that isn't draggable and show its Properties. Under the tab Advanced you can uncheck "Selection Allowed".
Exercise 4
Translated copies
Use the tool ![]() Vector to make a vector.
Vector to make a vector.
Create a geometric object, for instance a polygon or a circle.
Use to tool ![]() Translate by Vector to make many copies of the geometric object.
Translate by Vector to make many copies of the geometric object.
Use the tool ![]() Move to move the points defining the vector.
Move to move the points defining the vector.

Comment: If you want to make many copies you can also use lists or the spreadsheet.
Exercise 5
Addition of positive and negative number using random numbers
In order to generate a positive and a negative integer, you start by creating two variables. Write nr1 = 1 and nr2 = -1 in the input bar.
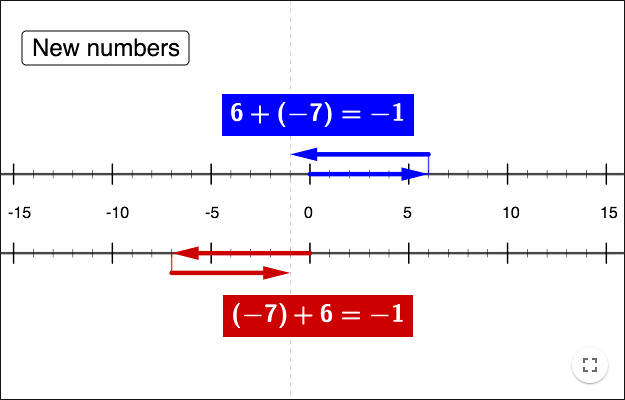
Use the tool ![]() Button to make a button "New numbers" and write following GeoGebra-script:
Button to make a button "New numbers" and write following GeoGebra-script:
SetValue(nr1, RandomBetween(1, 7))
SetValue(nr2, RandomBetween(-7, -1))
You will now demonstrate the addition using vectors and number lines. To demonstrate that \(nr1+nr2 = nr2+nr1\), you need two number lines.
Make two lines parallel to the \(x\)-axis at \(y = 2\) and \(y = -2\). You can either construct the lines using tools, or simply write
y = 2andy = -2in the input bar.-
Make vertical segments along the lines, using lists of segments. Make one list using the command:
Sequence(Segment((i, 2.2), (i, 1.8)), i, -20, 20)
Make segments for the other line in a similar way.
-
Enter values for the number lines using a list of text objects. The command
Text( <Object>, <Point> )creates a text of an object placed at a point. By using a fifth argument to the Sequence-command, you can choose a step. Write:Sequence(Text(i, (i - 0.3, -0.2)), i, -20, 20, 5)
Adjust the positions of the text elements so it looks good.
- Make two more lists of slightly longer segments that are shown at multiples of five.
Add points displaying the numbers involved on the two number lines, or slightly above or below a number line. Make vectors between points. Add dynamic text. Add other objects that help visualize the addition.
by Malin Christersson under a Creative Commons Attribution-Noncommercial-Share Alike 2.5 Sweden License