Least Square Fitting & Regression
When you try to fit a line to a number of points, you add the distances from the points to the line and minimize the sum of the squares of the distances. In mathematics the distance between a point and a line is defined as the shortest distant, i.e. the perpendicular distance. When you do numerical calculations however, there are various ways of defining the distance.
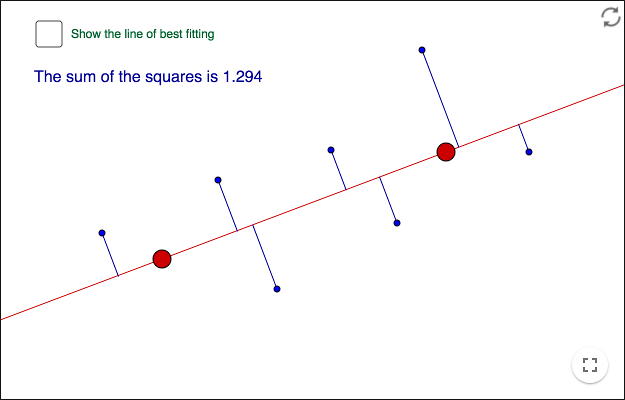
Perpendicular fitting
The segments are perpendicular to the red line. Move the line and try to get an optimal fitting. The line is optimal when the sum of the squares is minimized. Do not show the line of best fit until you have found a best fit by yourself.
Vertical fitting
The segments are vertical. Move the line and try to find an optimal fitting. Do not show the line of best fit until you have found a best fit by yourself.

The green line is made with the tool ![]() Best Fit Line. Which method is used by GeoGebra, a perpendicular or vertical
fitting?
Best Fit Line. Which method is used by GeoGebra, a perpendicular or vertical
fitting?
Regression in GeoGebra
Regression is used to fit a function to data.
There are several commands for regression in GeoGebra that work on list of points. To create a list of points, do this:
- Create some points.
- Click on the tool
 Create List. Drag the mouse over the graphics view to select points.
 - Write
Fitin the input bar and choose the command you want to use.
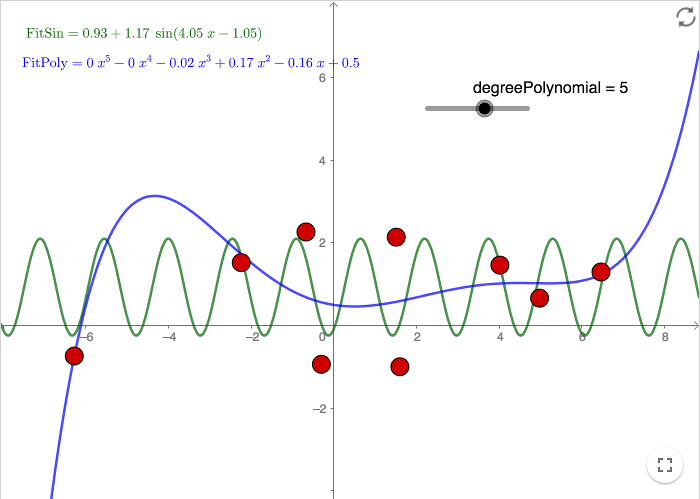
Note that high degree polynomials tend to have extreme values.
Women mathematicians and how math is taught in school
The data about the relative number of women mathematicians from some European countries, is taken from Statistics on Women in Mathematics / Catherine Hobbs & Esmyr Koomen.
The data about the relative percentage of pure+applied mathematics that is pure mathematics, in math education of different countries, is taken from OECD: Equations and Inequalities ‐ Making Mathematics Accessible to All.
| Country | Pure math (%) | Women mathematicians (%) |
|---|---|---|
| Denmark | 64.94 | 9.7 |
| Finland | 74.39 | 14.5 |
| Norway | 76.46 | 11.9 |
| Sweden | 67.06 | 12.4 |
| Austria | 77.05 | 9.2 |
| Belgium | 83.24 | 24.9 |
| France | 80.15 | 23 |
| Germany | 81.73 | 14.6 |
| Ireland | 77.3 | 10.4 |
| Netherlands | 90.48 | 9.8 |
| Switzerland | 77.99 | 6.7 |
| United Kingdom | 76.73 | 17.9 |
| Czech Republic | 83.13 | 26.4 |
| Estonia | 77.54 | 35.2 |
| Italy | 85.97 | 35 |
| Spain | 80.72 | 26.3 |
| Portugal | 86.8 | 47.6 |
Copy the numbers in the table above into GeoGebra. Selecting the entire table and then Copy/Paste to a GeoGebra spreadsheet should work.
Select the data in columns B and C and click on ![]() Two Variable Regression Analysis.
Two Variable Regression Analysis.
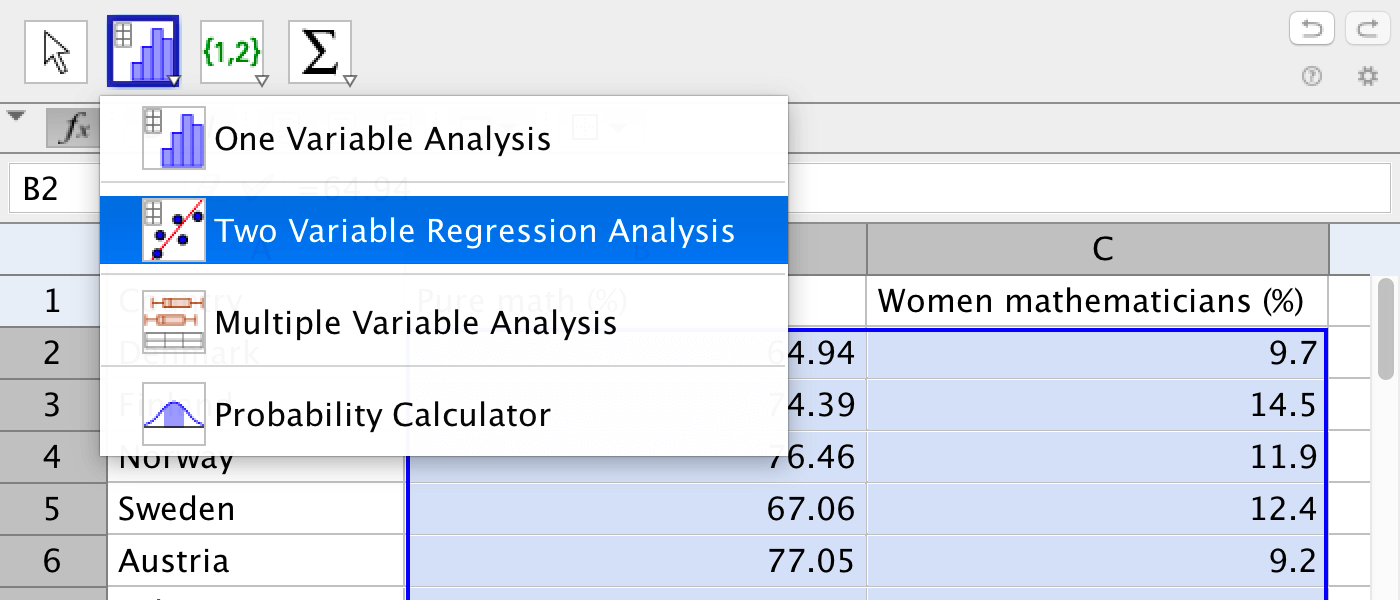
In the window that pops up, click on Analyze. Here you can find mean, standard deviation, correlation coefficients, and other data.
In order to show the data in the graphics view, having the same data selected, right-click and choose Create -> List of points. A list \(L_1\) is created. You can use the command FitLine(L_1) to fit a line to the data. You can use the command CorrelationCoefficient(L_1) to find the correlation coefficient.
If you want to see the name of the country at each point, enter the word Label i cell C1. Write Text(A2, (B2, C2)) in cell C2. Make relative copies along column C. Select the text objects and make sure that they are shown.

However, correlation does not imply causation.
Polynomial fitting
A (n-1)-degree polynomial will fit n data points exactly, i.e. each of the points will lie on the curve. High order polynomials can, however, be impractical for various reasons; they can be highly oscillatory and difficult to handle.
When making a polynomial fitting in GeoGebra you use two parameters; the first
one is the list and the second is the degree of the polynomial. Try the command
FitPoly[list1,n].
by Malin Christersson under a Creative Commons Attribution-Noncommercial-Share Alike 2.5 Sweden License