Epitrochoids and Hypotrochoids
On the page Geometry - Sun, earth and moon, it is shown how to make a model of the path of the moon without using trigonometry. By using trigonometry, you can define the path of the moon as a curve. The curve is an example of an epicycloid which is a curve closely related to curves called epitrochoids.
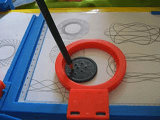
Epitrokoids and hypotrokoids are curves that children can draw by using a spirograph.
Make a curve
Make a model of the sun, earth and moon. Let \(O\) be the position of the sun, \(A\) of the earth, and \(B\) of the moon. Let \(R\) be the radius as the sun revolves around the sun, \(r\) the radius as the moon revolves around the earth,and \(m\) the number of months in a year.

Make a slider tMax representing the time. The curve drawn by the moon, is drawn between
the time zero and the time \(tMax\).
The time corresponds to the angle extended by the earth on its path around the sun. The angular velocity of the moon is \(m\) times as large. From the picture above, we get that \(A\) has the coordinates
\[A=(R \cos\alpha, R \sin\alpha)\]
\(B\) has the coordinates
\[B=(x(A)+ r\cos(m \alpha),y(A)+r\sin(m \alpha))\]
If we choose to write the coordinates of \(B\) in terms of the angle \(\alpha\), they are
\[B=(R \cos\alpha+ r\cos(m \alpha),R \sin\alpha+r\sin(m \alpha))\]
The command for making a curve in a GeoGebra, using a parameter \(t\), is
Curve[x(t), y(t), t, start, stop]
The command for drawing the curve of the moon is hence
Curve[R cos(t)+r cos(m t), R sin(t)+r sin(m t), t, 0, tMax]
Epitrochoids
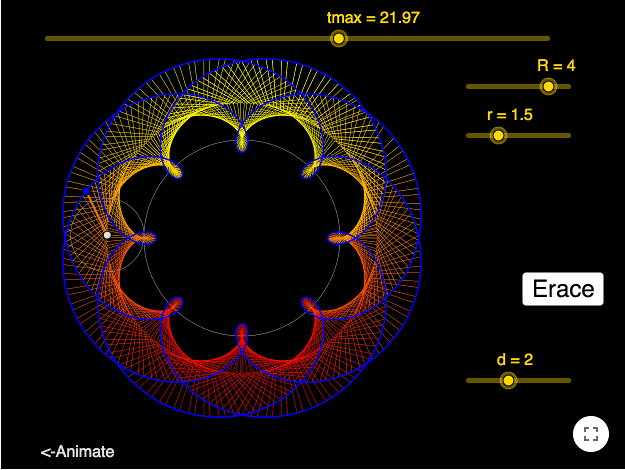
An epitrochoid is drawn when a small circle rolls on the outside of a large circle. If \(A\) is the midpoint of the small circle, a pen is put in a hole \(B\) at a distance \(d\) from \(A\).

If \(A\) moves in a counterclockwise order, \(B\) moves in a clockwise order.
Let \(R\) be the radius of the larger circle, and \(r\) be the radius of the smaller circle, then the coordinates of \(A\) are
\[A=((R+r)\cos \alpha, (R+r)\sin \alpha)\]
The coordinates of \(B\) are
\[B=(x(A)-d\cos(m\alpha), y(A)-d\sin(m\alpha))\]
\(m\) is the number of revolutions made by \(B\) around \(A\), as \(A\) makes one revolution around \(O\). \(m\) can be found by taking the ratio of the circumference of the circle made by \(A\) around \(O\) to the circumference of the circle made by \(B\) around \(A\). Since the circumference is proportional to the radius, \(m\) is also the ratio of the radii, yielding
\[m=\frac{R+r}{r}\]
Hypotrochoids
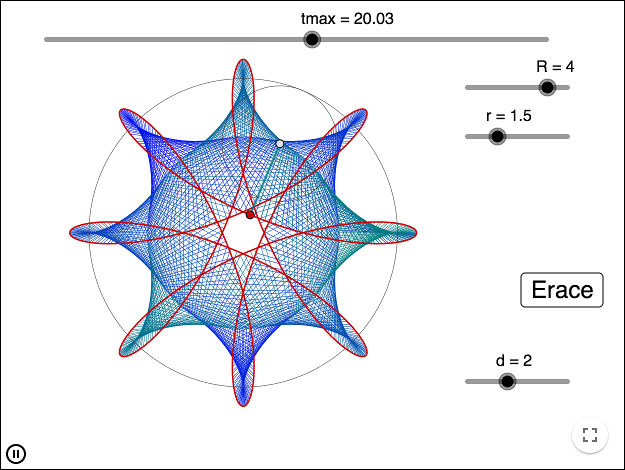
A hypotrochoid is drawn when a small circle rolls on the inside of a large circle. If \(A\) is the midpoint of the small circle, a pen is put in a hole \(B\) at a distance \(d\) from \(A\).

If \(A\) moves in a counterclockwise order, \(B\) moves in a clockwise order.
Let \(R\) be the radius of the larger circle, and \(r\) be the radius of the smaller circle, then the coordinates of \(A\) are
\[A=((R-r)\cos \alpha, (R-r)\sin \alpha)\]
The coordinates of \(B\) are
\[B=(x(A)+d\cos(m\alpha), y(A)-d\sin(m\alpha))\]
Using the same reasoning as for the epitrochoid, we get that
\[m=\frac{R-r}{r}\]
Hypocycloids and epicycloids
When \(d = r\) the curves are traced out by a point on the rolling circle. I these special cases, the curves are called hypocycloids
and epicycloids. For interactive examples of patterns made by rolling hypocycloids and epicycloids see
Rolling Hypocycloids and Epicycloids.
animated gifs:
Hyotrochoid on tumblr.
reference:
the picture of the spirograph made by Kungfuman
by Malin Christersson under a Creative Commons Attribution-Noncommercial-Share Alike 2.5 Sweden License