Tables and Spreadsheet
To show the relationship between two sets, you can start by making a table of values. After doing so, you represent the first column by values along the \(x\)-axis and the second column by values along the \(y\)-axis. The result is a set of points in a Cartesian coordinate system. In order to plot points from a table using GeoGebra, the spreadsheet is used.
The most common usage of spreadsheets is to use numbers in the spreadsheet cells. In GeoGebra however, you can also use regular GeoGebra objects within the spreadsheet. On the page GeoGebra Tutorial - Spreadsheet, it is shown how to use the spreadsheet to make relative copies of any object in GeoGebra.
Exercises
Exercise 1
From table to points in a Cartesian coordinate system
Make a new GeoGebra worksheet. Choose View->Spreadsheet.
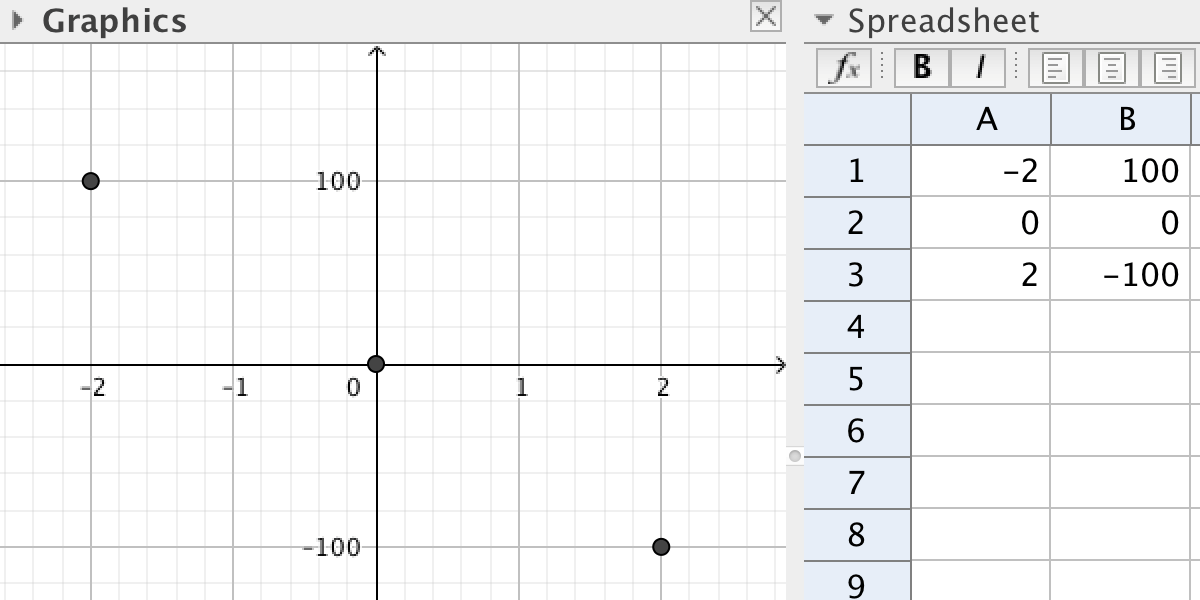
Enter the numbers from the picture above into the spreadsheet. The numbers in column A are the x-values and the numbers in column B the y-values. Each number is written in a so-called cell. The cells are named after column and row. The number -2 is written in cell A1 and the number -100 in cell B3.
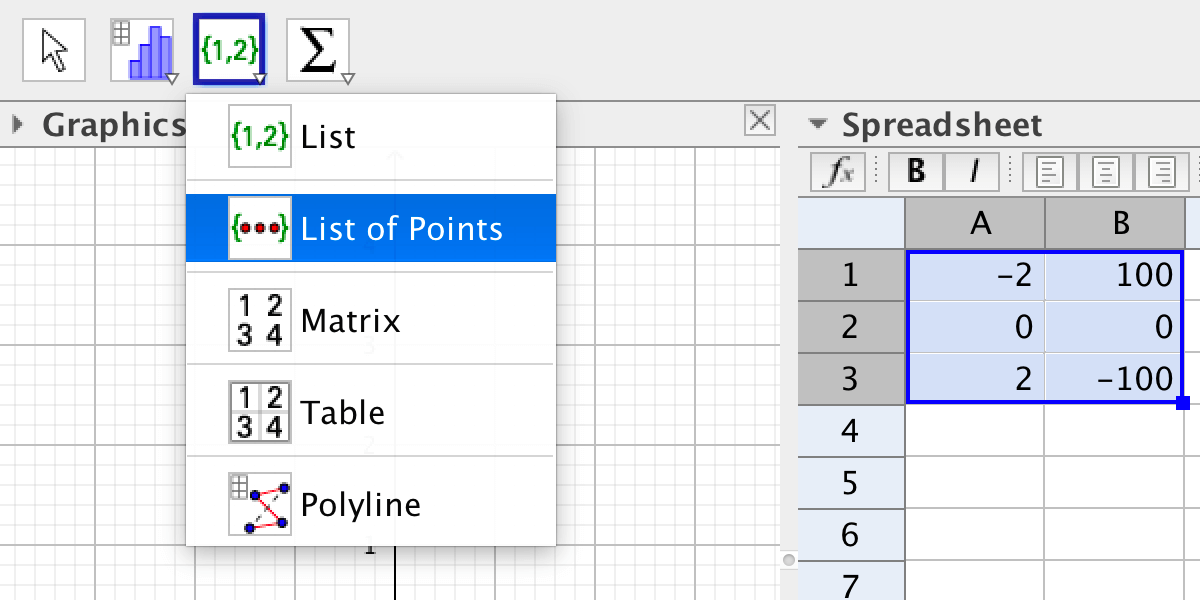
Select the six cells by dragging the mouse. Do not drag the small blue square at the lower right
corner. The cells become blue. Choose the tool
Create List of Points.
Note that while the spreadsheet is selected, a tool bar for the spreadsheet is shown. If you want to see the regular tool bar, click on the drawing pad.
To see the points created, you must either change the scale of the axes or zoom out. You zoom in or out by using the mouse wheel; the drawing pad must be selected in order to zoom.
To change the scale, use the tool
![]() Move the Graphics View.
Then hover the mouse over an axis until the curser changes to an arrow. When the curser is
an arrow you can drag the axis. You can also rescale the axes by holding down the
Shift-key.
Move the Graphics View.
Then hover the mouse over an axis until the curser changes to an arrow. When the curser is
an arrow you can drag the axis. You can also rescale the axes by holding down the
Shift-key.
Exercise 2
Relative copy
Show the input bar belonging to the spreadsheet.
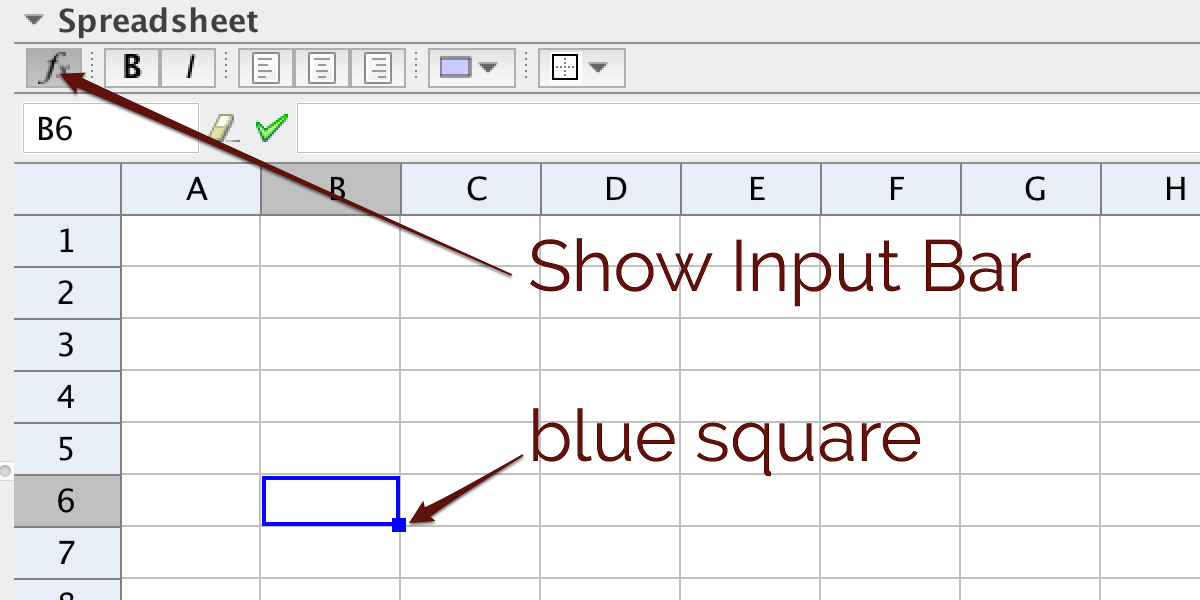
The little blue square in the lower right corner of a cell is used for making relative copies.
Try to enter 1 in A1 and =A1+1 in A2, then drag the small blue square along column A. Enter
the same formula in B1 and make relative copies in row 1. Select B5 to see the expression that has been copied.
2.a - Generate a pattern of numbers
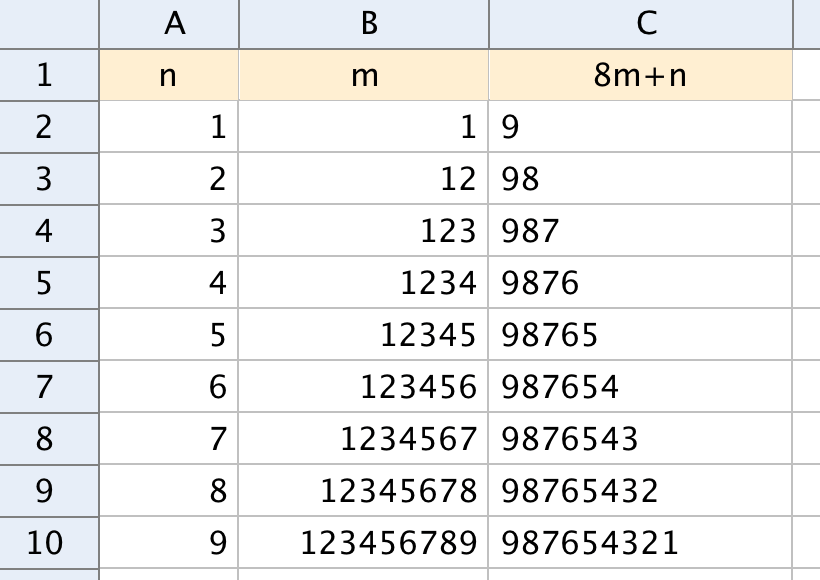
Generate column A using relative copies. Enter the numbers in column B by hand. Use the formula in C1 to generate column C using relative copies.
2.b - Relative copies from all cells
Column B in the picture above, can also be generated using relative copies. Delete the content of the cells B1 to B10. Enter 1 in B2 and find a spreadsheet-formula for generating B3 to B10 using relative copies.
Exercise 3
Relative och absolute copies
By writing $A1, you make an absolute reference to A1 when dragging along a row.
By writing A$1, you make an absolute reference to A1 when dragging along a column.
By writing $A$1, you make an absolute reference to A1 when dragging along both a row and a column.
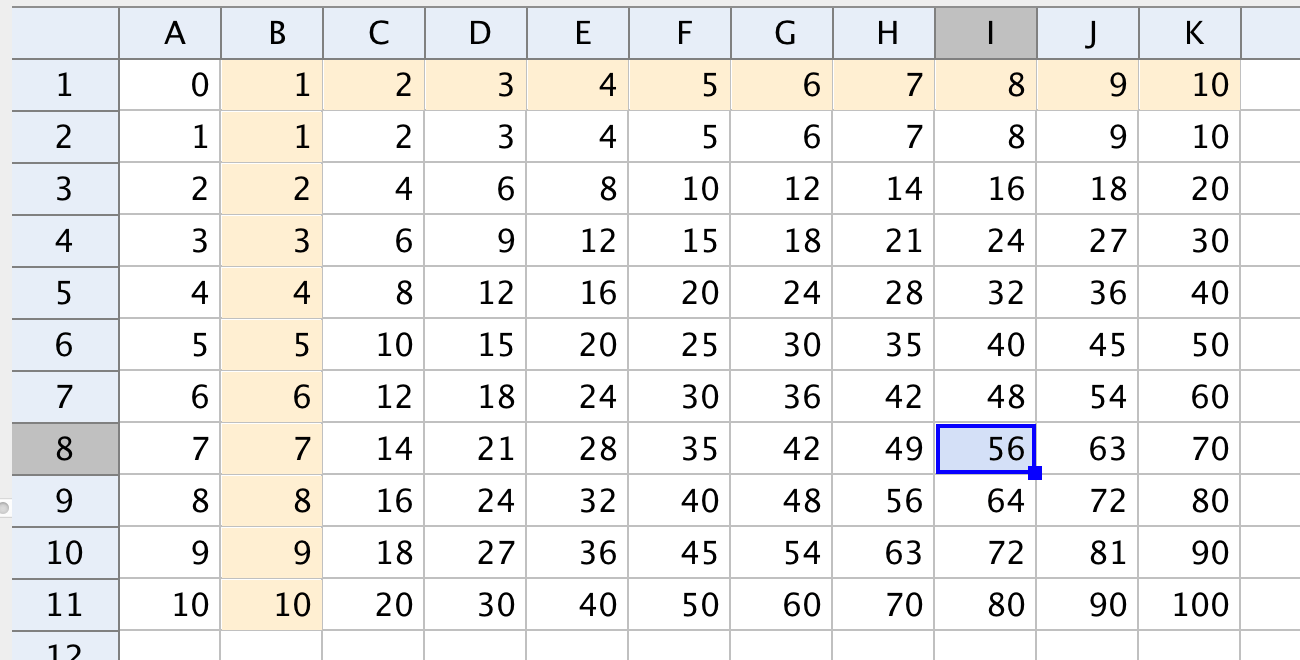
Use both relative and absolute copies to generate a multiplication table.
Exercise 4
From formula to table to points in a Cartesian coordinate system
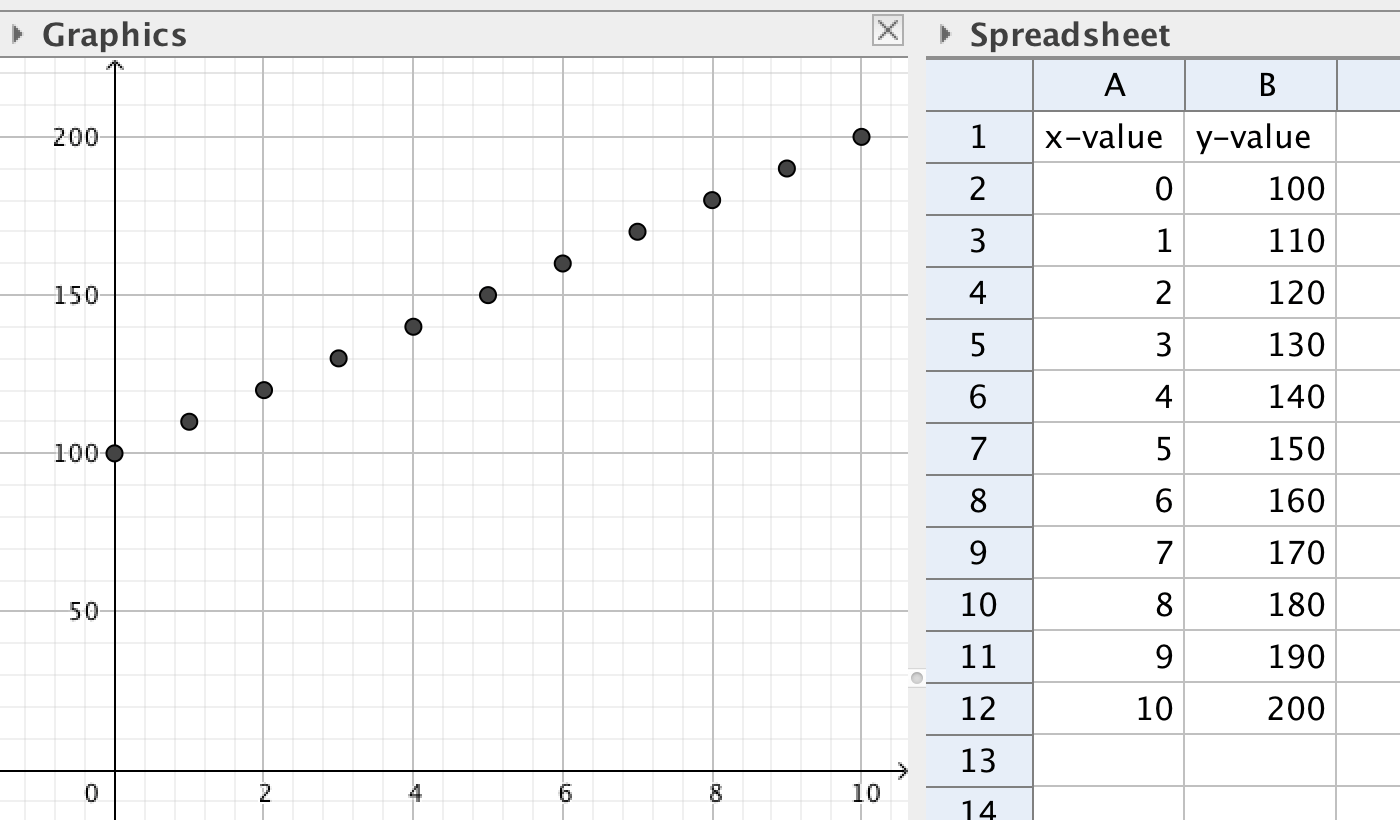
Use the formula \(y=100+10x\) to make a table of values when \(x=0,1,\ldots 10\). Then generate the corresponding points in the graphics view.
by Malin Christersson under a Creative Commons Attribution-Noncommercial-Share Alike 2.5 Sweden License