Mean and standard deviation
Bar Charts
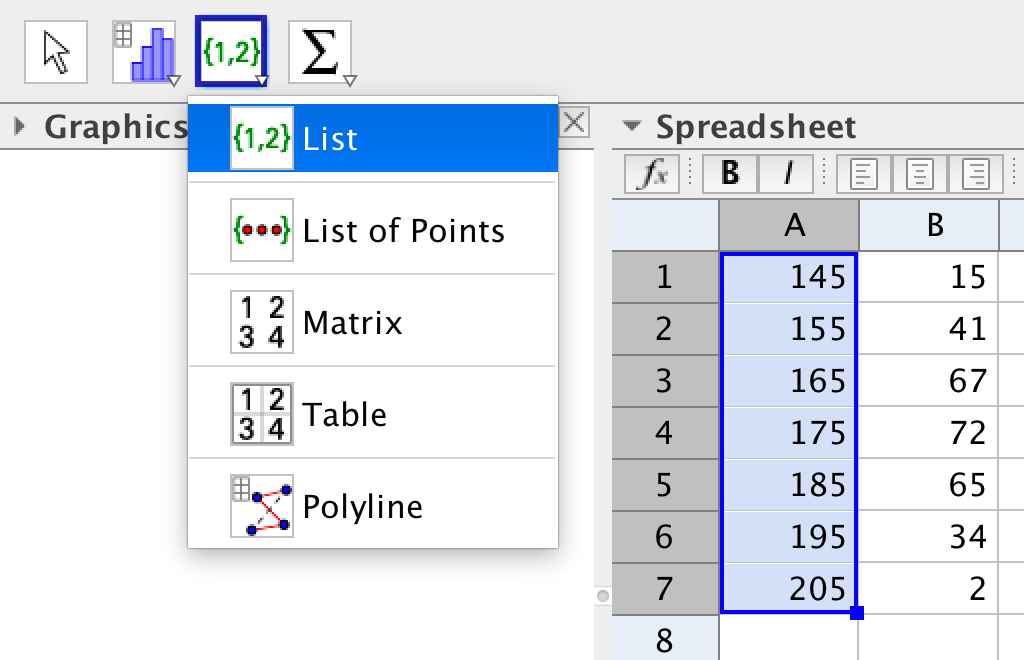
Given a frequency table, you can make a bar chart. Start by entering following
data into the spreadsheet. The mid value of the first interval is 145. Enter 145 into A1. Enter =A1+10 into A2 and press enter.
Make relative copies by dragging the blue square at the bottom right corner of A2.
| Height (cm) | Frequency |
|---|---|
| 140-150 | 15 |
| 150-160 | 41 |
| 160-170 | 67 |
| 170-180 | 72 |
| 180-190 | 65 |
| 190-200 | 34 |
| 200-210 | 3 |
You need two lists, one of the data and one of the frequencies. Create one list from each column.
In order to make a bar chart you use the command:
BarChart[name of the List of data, name of the List of frequencies]
The numbers in the list of data must go up by a constant amount.
Note that if you enter a command in the input bar and press F1 you get help.
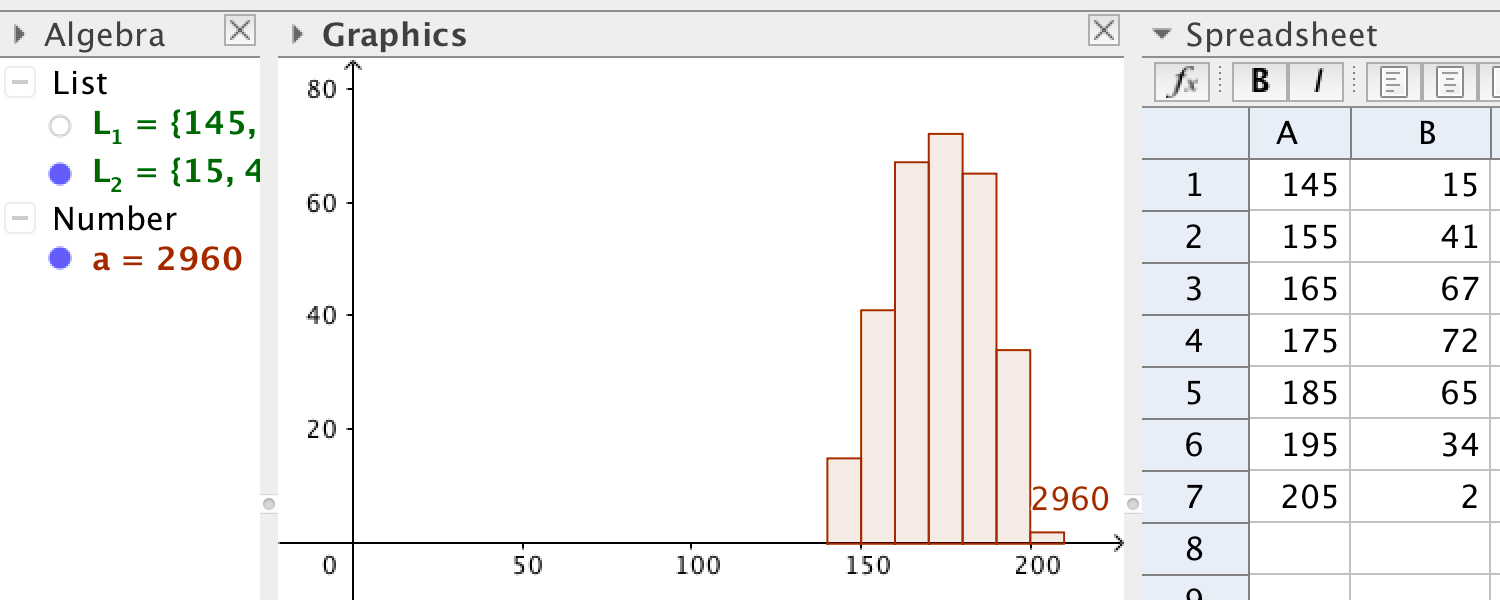
The bar chart in the picture above is called \(a\), the value of \(a\) is the area of the bar chart.
If you have a frequency table, you have one column of data and one column of frequencies. Let \(f_i\) denote the frequency and \(x_i\) corresponding data. The formulas for the mean \(\mu\) and the standard deviation \(\sigma\) are:
where \(k\) is the number of data and \(n=\sum_{i=1}^{k}f_i\).
Expectation value and variance
If a random variable \(X\) can take values \(x_i\) with probability \(p_i\), then the most expected value of an outcome is called the expectation value \(E[X]\).
\[E[X]=p_1x_1+p_2x_2+\ldots +p_kx_k=\sum_{i=1}^kp_ix_i\]
The value \(x_i\) deviates from the mean \(\mu\) by the value \(|x_i-\mu |\). For computational reasons, it is easer to consider the square than the absolute value, \((x_i-\mu)^2\). The most expected value of the squares of the deviations is called the variance \(Var(X)\).
\[Var[X]=p_1(x_1-\mu)^2+p_2(x_2-\mu)^2+\ldots +p_k(x_k-\mu)^2=\sum_{i=1}^kp_i(x_i-\mu)^2\]
If you are given a frequency table with data values \(x_i\) and frequencies \(f_i\), and if \(n=\sum_{i=1}^{k}f_i\), then the probability of the outcome \(x_i\) is \(p_i=\frac{f_i}{n}\). From this we get that:
Statistical one variable analysis
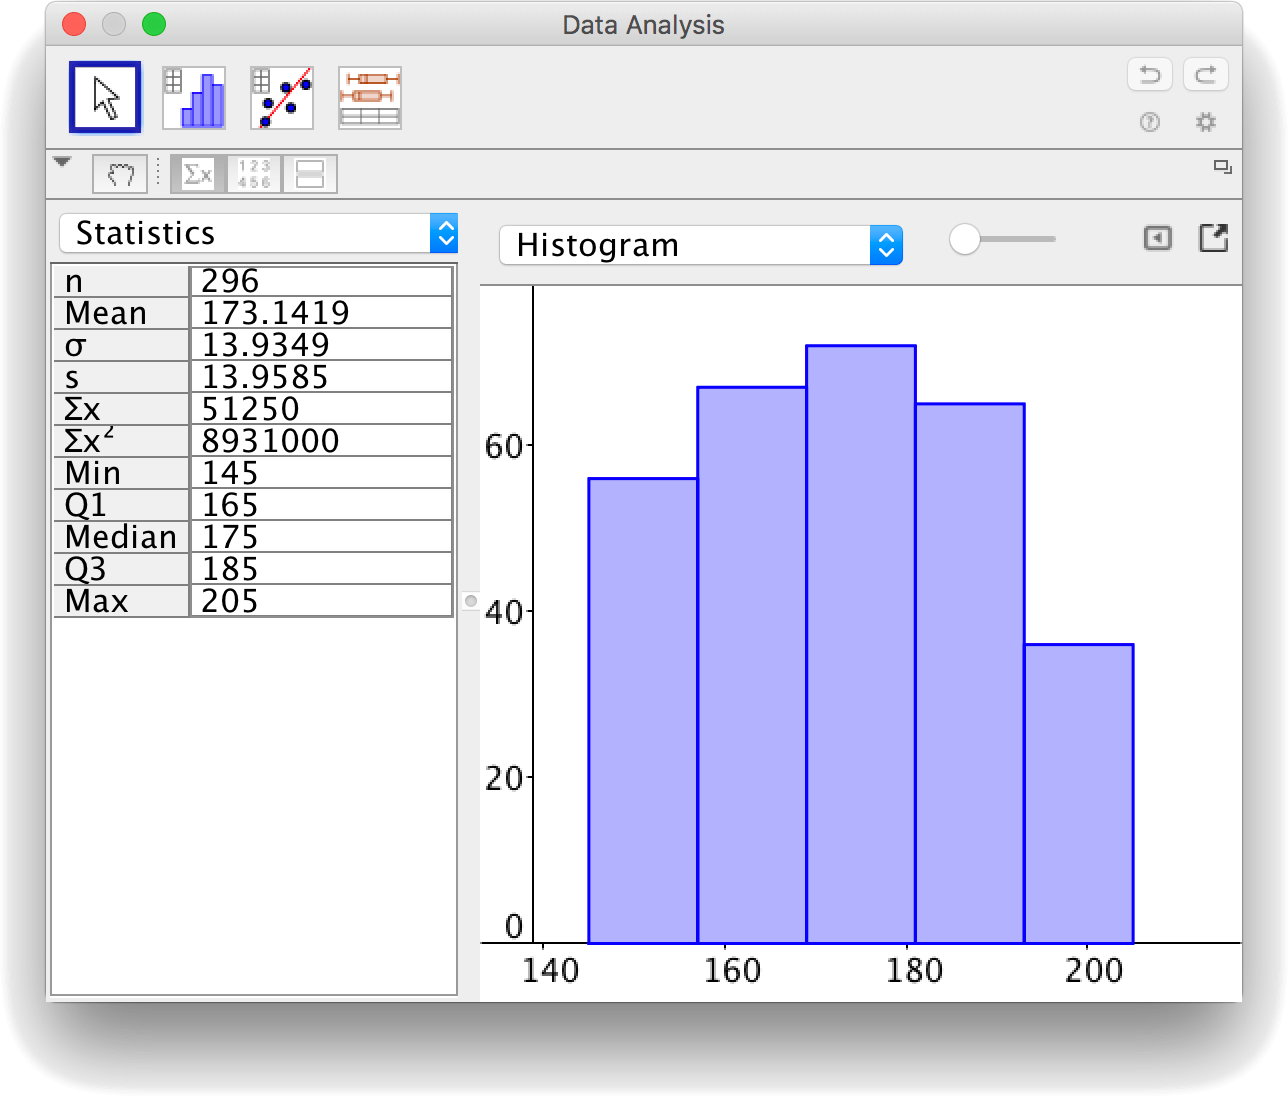
As of GeoGebra 4.0 you can make a statistical one variable analysis, and hence find the mean and the standard deviation. The GeoGebra tool uses either one column of data or several columns of grouped data. It can however not handle a frequency table. If you have a frequency table, you must turn it into a table of grouped data.
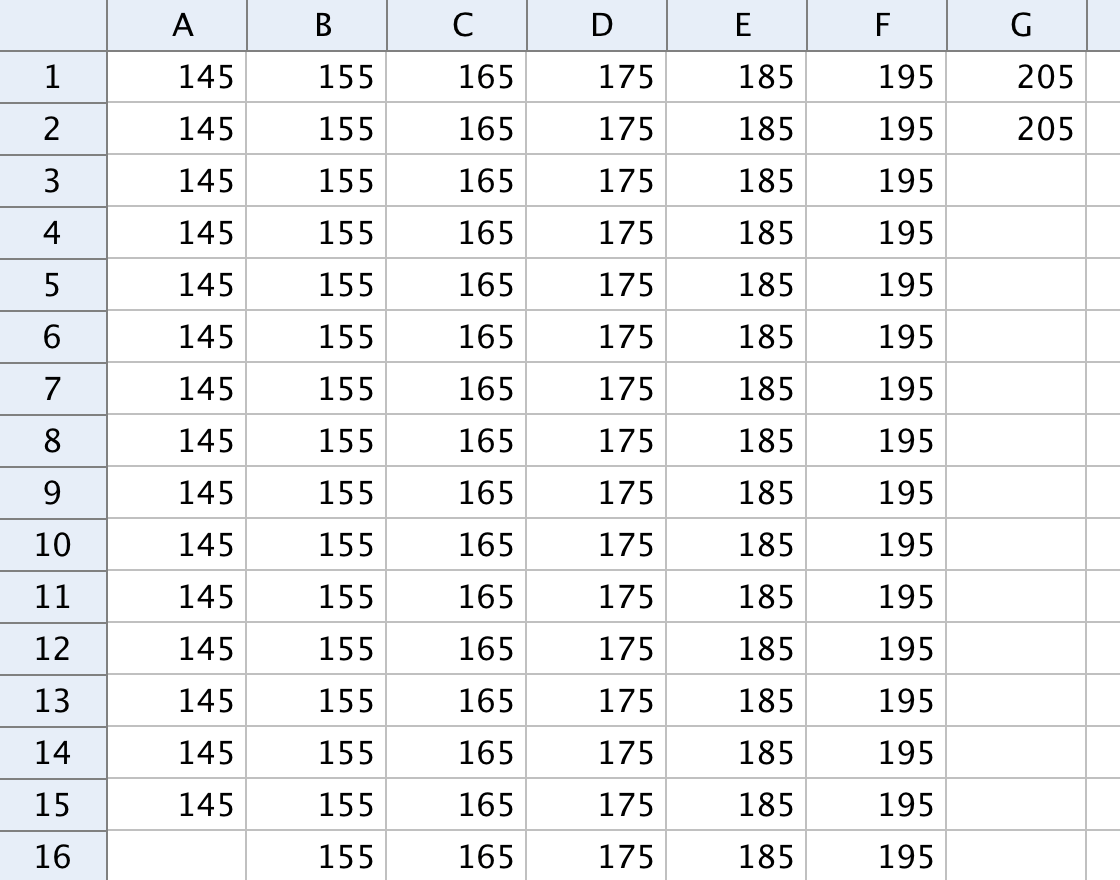
In the picture above columns A-G contain grouped data.
Select columns A-G and choose the tool "One Variable Analysis".
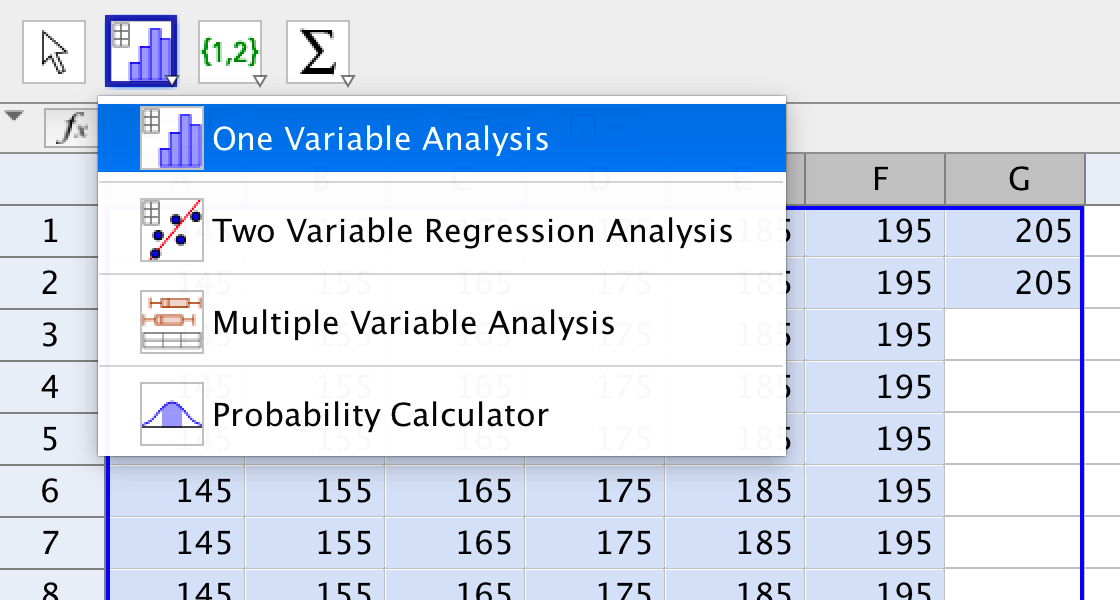
In the window that pops up, you will find all statistical facts about the grouped data.
by Malin Christersson under a Creative Commons Attribution-Noncommercial-Share Alike 2.5 Sweden License